论文总字数:16807字
目 录
1 引言 1
2 研究进展 1
3 资料与方法 2
3.1资料 2
3.1.1研究区域概况 2
3.1.2 数据来源与处理 2
3.2方法 3
3.2.1 线性趋势分析 3
3.2.2 M-K趋势检验与突变分析 3
3.2.3 EOF分析 5
3.2.4 GIS技术 5
4 结果与分析 5
4.1 淮河流域热量资源的趋势分析 6
4.1.1 ≥0℃和≥10℃积温的变化 6
4.1.2 ≥0℃和≥10℃持续日数的变化 6
4.2 淮河流域热量资源的突变分析 7
4.2.1 ≥0℃和≥10℃积温的M-K突变分析 7
4.2.2 ≥0℃和≥10℃持续日数的M-K突变分析 8
4.3 淮河流域热量资源的空间变化 8
4.3.1 ≥0℃和≥10℃积温的趋势分布 8
4.3.2 ≥0℃和≥10℃持续日数的趋势分布 9
4.3.3 ≥0℃和≥10℃积温的年代际分布 10
4.3.4 ≥0℃和≥10℃持续日数的年代际分布 10
4.4 淮河流域热量资源的EOF分析 11
4.4.1 ≥0℃积温 11
4.4.2 ≥10℃积温 12
5 结论 12
参考文献 13
致谢 15
淮河流域热量资源的时空格局研究
叶鸣
,China
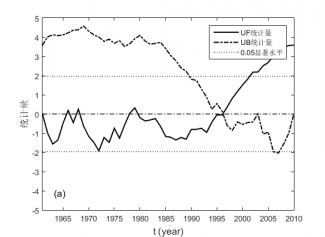
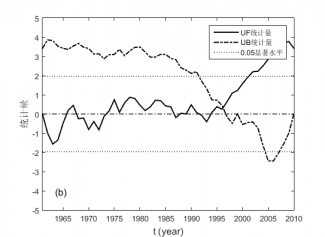
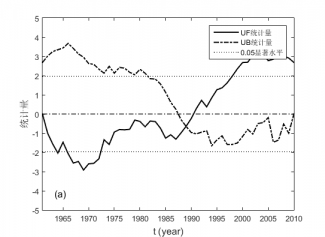
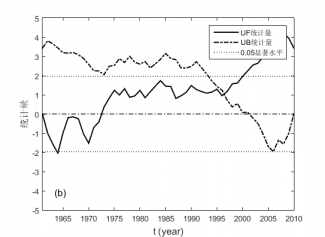
Abstract:Based on using the daily average temperature data of 26 meteorological stations in the Huaihe river basin for 1961 to 2010, a 5-day moving average method was adopted to get the accumulated temperature and lasting days at or above 0℃ and 10℃ year by year. The temporal and spatial patterns of thermal resources in Huaihe river basin are studied by using linear trend estimation, M-K test and EOF analysis. The results show that the accumulated temperature of the Huaihe river basin at or above 0℃ and 10℃ showed a significant growth trend. The climate tendency rates were above 74.3℃·d/10 and 64.2℃·d/10a. The lasting days at or above 0℃ and 10℃ also showed a significant growth trend. The climate tendency rates were above 3.8 d/10a and 2.6d/10a. The accumulated temperature at or above 0℃ and 10℃ all changed abrupt in 1996, and showed a significant increase after the mutation. The number of lasting days at or above 0℃ decreased abrupt after 1989, while the number of lasting days at or above 10℃ increased significantly after 1996. The accumulated temperature and lasting days at or above 0℃ and 10℃ steadily increased higher in the eastern region than in the western region. After EOF analysis, the first mode of the accumulated temperature at or above 0℃ generally presents a decreasing distribution pattern from the southeast coast to the northwest inland, the second mode shows a low distribution pattern in the East and the West and a high distribution pattern in the North and the South. The first mode of accumulated temperature at or above 10 ℃ presents a decreasing distribution pattern from east to west, the second mode presents a decreasing distribution pattern from south to north. In order to promote the positive effect of the changes of thermal resources, we should constantly adjust the planting system and optimize the allocation of agricultural production so as to adapt to climate change.
Key words:Huaihe river basin;Thermal resources;Accumulated temperature;Lasting days
1 引言
根据IPCC第四次评估报告显示,全球气温普遍升高,最近100年的温度线性趋势为约0.74℃[1],全球气候变暖已经得到了广泛共识。气候变化已经引起专家们的广泛关注,随着中国社会的快速发展,我国的气温不仅在不断升高,而且升高的幅度略高于全球平均值。动植物乃至人类进行生产和生活时,热量资源是必需的气候资源之一。地球表面的热量大部分来自于太阳辐射,通过大气循环引起空气和土壤温度的变化。我国大部分地区位于亚热带和热带地区,热量资源非常丰富,但我国所处的地理位置很特殊,位于欧亚大陆的东岸、太平洋西岸,因此环流盛行,导致热量资源变化的非常复杂。冬季我国北方冷空气强盛且不断南下,而夏季不断有气团北上,控制了东部大部分地区。冬夏季不断循环交替的气流运动使得热量资源的时空变化非常复杂,且南北、东西地区的差异较大。
温度对人类的各种生产生活都有非常大的影响,而热量资源的衡量通常用与温度有关的各种指标。因此在气候资源分析中,热量资源的分析显得至关重要。热量资源与很多行业的生产都密切相关,例如渔业、林业、畜牧业等,而农业是气候资源中对热量资源要求最高的一个部门。温度条件是农作物完成某一生育期所必需的条件,并且仅当温度积累到所需要求时,作物的某一生育期才能最终完成。热量是动植物乃至人类生存生活的重要生态基础。因此,研究热量资源的时空分布格局对农业气候区划以及工农业生产的合理布局等都具有重要的意义。本文利用淮河流域1961-2010年26个站点逐日平均气温资料,运用线性趋势分析、显著性检验、M-K趋势检验和突变分析、EOF分析等方法,分析≥0℃、≥10℃的积温和持续日数的时间变化和空间分布,揭示淮河流域热量资源的时空格局。
2 研究进展
目前,我国针对不同地区和范围的热量资源的时空分布已经进行了许多研究,这些研究主要选取年平均气温、气温日较差、气温年较差、1月和7月平均气温、积温、稳定通过某一界限温度的持续日数等作为热量指标。研究内容包括不同区域热量资源的变化特征、不同农作物生育期内热量资源的时空分布特征及其对作物种植和生长发育的影响等方面,研究区域不仅有针对我国各区域(东北、华东、辽西、华西、华南等)的分析,也有针对某个特定的省、市、县等的分析 [2-8]。在国外,衡量热量资源的指标与国内有所不同。在波兰,Elwira Z_mudzka[9]提出用等于或高于第90百分位的季节或不大于第10百分位指定的季节的有效积温来定义极端热量资源,建立了热量资源的长期趋势和波动模式。
从气候变化的角度,叶金印等[10]分析了近50年以来淮河流域常规气候要素的分布和变化,得出淮河流域年平均气温在全球气候变化的背景下,随时间不断升高,且在空间分布上具有显著差异的结论。针对淮河流域热量资源时空变化特征的分析,已经成为国内专家们的研究热点之一。苗茜等[11]分析了淮河流域近47年热量资源的变化趋势,认为淮河流域各界限温度的积温、持续日数均呈现显著增加趋势。陆阳等[12]运用趋势分析、M-K检验和R/S方法对淮河流域的气温等要素进行趋势分析和突变检验,指出气温呈现明显突变上升趋势。缪启龙等[13]立足于分析中国整个区域,全面阐述热量资源的分布特征,指出中国≥0℃、≥10℃的积温和持续日数不断增加,且东部地区的增幅比西部地区大。
我国学者对淮河流域热量资源已经开展了很多研究,并且对该地区热量资源的合理利用以及合理调整作物生产、种植和耕作制度产生了许多积极的影响。但是研究仍然存在几方面的不足:第一,主要采用线性趋势分析和M-K检验方法进行分析,没有使用多种检验方法,验证分析结果的可靠性;第二,在气候变暖的背景下,系统阐述淮河流域热量资源时空格局的研究较少。因此,本文运用线性趋势分析、M-K检验和EOF分析等方法研究热量资源的时空分布格局。结合多种分析和检验方法,增强分析结果的可靠性,以期对淮河流域热量资源的时空格局进行整体、全面的研究。
3 资料与方法
剩余内容已隐藏,请支付后下载全文,论文总字数:16807字
相关图片展示:
