论文总字数:16482字
目 录
1引言 1
1.1研究目的意义 1
1.2国内外研究进展 1
2数据来源 2
3研究方法 2
3.1线性回归 2
3.2 9年滑动平均 3
3.3突变年检验 3
4近50年气候变化特征 3
4.1气候年际变化特征 3
4.2气候距平变化特征 6
4.3气候突变年检验 8
5气候因子之间相关性研究 11
6小波变换分析 11
7结论 12
参考文献 13
致谢 16
近50年西藏阿里气候变化特征分析
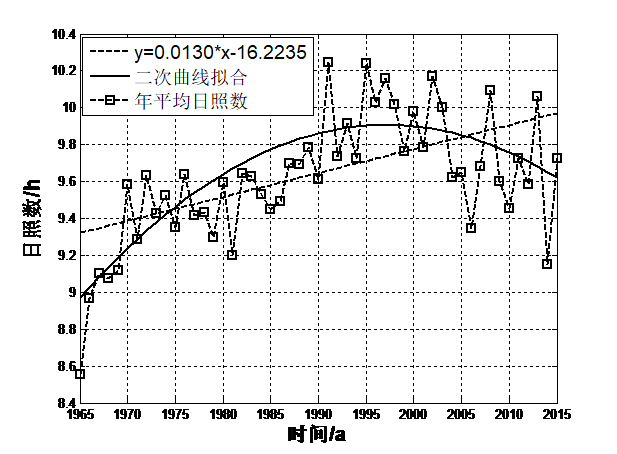
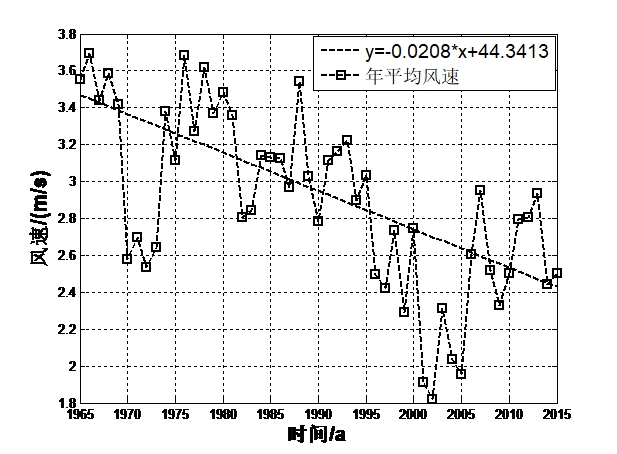
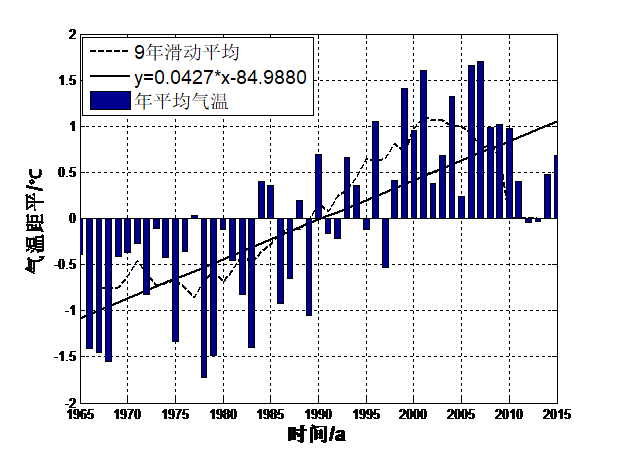
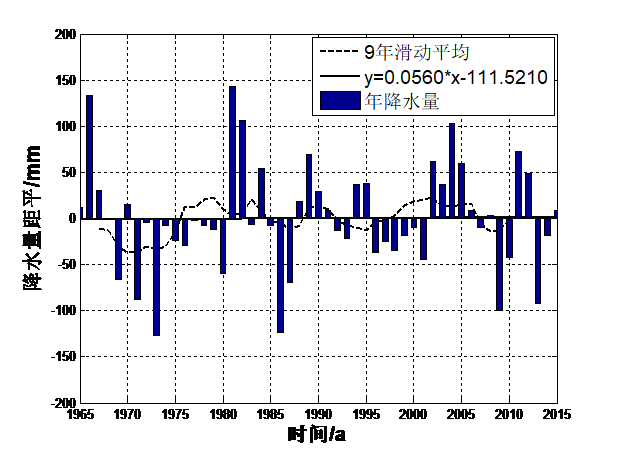
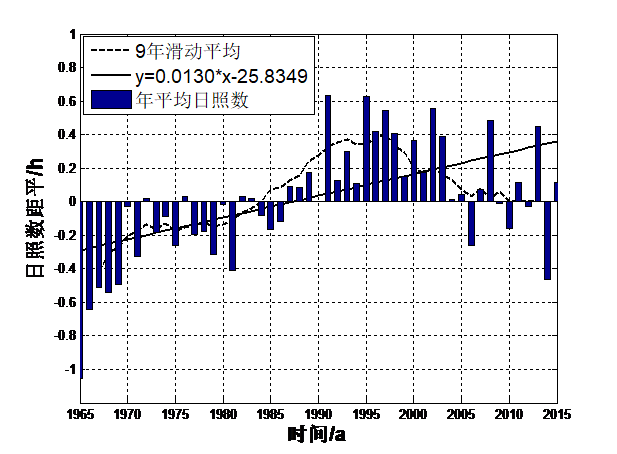
摘要阿里地区由于海拔较高,气候相对较为恶劣,从而形成了及其脆弱的生态系统,气候对维持整个青藏高原的生态系统具有十分重要的作用,且气候对维持高原地区冰川的平衡也具有一定的作用。因此,本文主要利用阿里地区1965-2015年年平均气温、年总降水量、平均日照数、平均风速这四个因子地面气象实际观测资料,采用了气候倾向率、突变年检验、相关性分析等统计方法,研究阿里地区近50年来气候演变规律。研究表明:(1)年平均气温均值为0.65℃,且每10年该地区的年平均气温增温约0.427℃,年总降水量均值为233mm,每10年该地区的降水量增多约0.560mm,年平均日照数均值为9.6h,每10年该地区的平均日照数增多约0.130h,年平均风速均值为2.88m/s,每10年该地区的平均风速减少约0.208m/s。;(2)阿里地区年平均气温存在一个显著地由低温向高温演变的过程,在1961-1989年之间年平均气温相对较低,在1990-2015年期间平均气温相对较高,1990年为阿里地区年平均气温演变的一个分界年。在1965-1980年之间年降水量相对较低,年降水量存在多个分界年;在1965-1986年之间阿里地区年平均日照数相对较少。在1987-2015年期间年平均日照数相对较多,1994年为阿里地区年平均日照数演变的一个分界年。在1965-1995年之间阿里地区年平均风速相对较大,在1996-2015年期间年平均风速相对较小,1991年为阿里地区年平均风速演变的一个分界年;(3)各气候因子之间存在一定的相关性的关系。其中平均风速与平均气温之间的相关性程度最高,计算出的相关性系数为-0.60,说明了两者之间存在显著的负相关性的关系,其次是平均日照数与平均风速,计算出的相关性系数为-0.45,说明了两者之间也存在显著的负相关性的关系。
关键词:阿里;气候倾向率;线性回归;突变检验;滑动平均;相关性
Analysis of climate change characteristics in Tibet in recent 50 years
Abstract Ali area due to the high altitude, the climate is relatively poor, thus formed and fragile ecosystems, ecosystem climate to the maintenance of the Qinghai Tibet Plateau plays an important role in maintaining the balance of climate, and the plateau glacier also has certain function. Therefore, this paper mainly use the Ali 1965-2015 annual average temperature, annual precipitation, average sunshine duration and average wind speed of the four factors of Ground Meteorological Observational data, the climate tendency rate, mutation test and correlation analysis statistical methods for years, Ali area of nearly 50 years of climate evolution. Research shows that: (1) mean annual temperature is 0.65 DEG C, and every 10 years the average annual temperature in the area by about 0.427 degrees Celsius, the annual total rainfall mean 233mm, every 10 years, the precipitation in this region increased about 0.560mm, the average annual sunshine average value is 9.6h, every 10 years the average sunshine area the number of annual average wind speed is about 0.130h, the mean 2.88m/s, every 10 years the region's average wind speed reduced by about 0.208m/s. The annual average temperature; (2) Ali Region has a significantly from low temperature to high temperature evolution process, in the years 1961-1989 the average annual temperature is relatively low, in the period 1990-2015 the average temperature is relatively high, 1990 Ali of annual mean temperature in the evolution of a dividing year. During the period of 1965-1980 years, the annual precipitation is relatively low, and the annual precipitation has a number of dividing years. The average annual sunshine duration in the area of 1965-1986 is relatively small. During the period of 1987-2015, the annual average sunshine number is relatively large, and in 1994, it is a boundary year for the evolution of the annual average sunshine number. In the years 1965-1995 Ali area, the annual average wind speed is relatively large, relatively small during 1996-2015 years the average wind speed, in 1991 the annual average wind speed in Ali area of the evolution of a boundary; (3) the annual average temperature of significant mutations for the year 1990, the annual precipitation was the mutation in many years, the average annual sunshine number no mutation year significantly, the annual average wind speed significantly change year 1989; (4) the relationship between the relationship between the climate factors. The degree of correlation between the average wind speed and average temperature of the highest correlation coefficient was calculated as -0.60, explained the relationship between there was a significantly negative correlation between the two, followed by the average number of sunshine and the average wind speed, the correlation coefficient was calculated as -0.45, illustrates the relationship there is a significant negative correlation between the two.
Key words: Ali; climate tendency rate; linear regression; mutation test; moving average; correlation
1引言
1.1研究目的意义
研究表明,我国的气候正发生着重大的变化,造成了一系列的自然气候灾害,特别是极端气候对自然生态系统和人类活动造成了严重威胁,造成的损失越来越严重。根据研究资料显示,全球每年因为极端气候造成的直接经济损失高达2000亿元[1]。全球气候的重大变化对国家和人类生命安全构成重大威胁,对区域温度和气候的研究已成为当前工作的热点[2-3]。青藏高原是我国气候的重要组成部分,且处于一个较为敏感的地带。因此,研究阿里地区气温气候变化特征,具有十分重要的意义。
有学者研究表明,青藏高原具有显著的地动力作用,该动力作用对北半球的气候构成了一定的影响[4-7]。青藏高原处于我国高海拔地带,对气候的响应要明显强于低海拔地区[8-9]。青藏高原气候的变化对我国甚至全球气候具有一定的作用,而气温气候的变化具有十分重要的地位。
阿里地区由于海拔较高,气候相对较为恶劣,从而形成了及其脆弱的生态系统,气候对维持整个青藏高原的生态系统具有十分重要的作用,且气候对维持高原地区冰川的平衡也具有一定的作用。综上分析,阿里地区气候不仅对自身的生态系统构成影响,还会影响到其余低海拔地区。因此,研究阿里地区气候的变化特征并掌握其演变规律具有极其重要的意义。研究其气候变化趋势对研究西南地区气候变化工作的开展具有科学的指导意义。本文主要利用拉萨地区1965-2015年地面气象实际观测资料,采用了气候倾向率、突变年检验相关性分析等统计方法,从时间角度分析研究近五十年来该区域气温演变规律。
1.2国内外研究进展
目前国内外有很多学者采用了不同的方法对不同区域的气候变化特征进行了研究。益西曲珍等[10]利用西藏地区38个测站实际观测资料,采用了小波分析等统计学方法,主要研究了西藏地区近四十年来气温变化规律。结果表明,西藏地区气温近四十年总体呈增温的演变趋势。杜军等[11]使用西藏地区多个测站4个时间段内的观测资料,采用了非参数估计等方法,对西藏地区气温时空演变规律进行了研究。研究表明,西藏地区气温与海拔之间存在显著性的相关性关系。杜军等[12]利用拉萨地区近半个世纪逐日气温数据,主要研究了拉萨地区近半个世纪气温震荡周期变化规律。结果显示,拉萨地区年平均气温呈逐年增温的演变规律,且存在3个显著的周期演变规律。段安民[13]利用拉萨地区近四十四年气温统计数据,从周期演变尺度角度研究了拉萨地区气温演变规律,并对气温经小波计算后的能量谱以及系数谱之间的差异性进行了分析。吴林等[14]利用广西贺州地区近30年的地面观测资料,研究了贺州地区年平均气温以及干旱指数变化规律。研究表明,该地区多年平均降水量在演变的过程中存在两个显著的周期变化规律,且4个季节均呈减少的演变趋势。陆虹等[15]利用广西省石漠地区逐年观测的气温资料,研究了该地区降水量以及年平均气温变化趋势。结果显示,石漠地区年平均气温与降水量之间存在负相关性的关系。何如等[16]利用实际观测资料,主要研究了广西省近海岸气候变化趋势。研究表明,广西近海岸区域年平均气温逐渐变暖且降水量逐年增多。覃卫坚等[17]利用广西地区1951-2008年地面气象观测站资料,采用了蒙特卡洛方法,主要研究了广西省气温气候变化特征。结果表明,广西省年平均气温近50年呈增温的变化趋势,年平均气温增高了0.6℃,年平均气温增加幅度远高度全国年平均气温变化趋势。崔林丽[18]等研究结果显示,长江三角洲地区气温存在显著的空间分布不均匀性,总体上呈现出在大城市年平均气温略高于其它区域。
国外主要有Mann[19]等根据全球近500年气温统计资料,研究了全球年平均气温百年变化趋势。研究显示出,全球年平均气温在近500年的演变过程中存在两个显著的振荡周期。Lau[20]等利用全球地表气温统计数据,采用了小波变换等方法研究了全球气温演变周期规律。结果表明,全球地表气温存在两个显著的长时间周期变化规律,分别为60年、80年。Jones[21]等对北半球年平均气温变化规律进行了分析研究,指出北半球年平均气温存在一个20年左右的长时间周期变化规律,之后借助实验仪器测量结果进一步证实了这个长时间的演变周期[22]。
2数据来源
本文利用阿里地区狮泉河、改则、普兰这三个气象站1965-2015年逐日气候实际观测资料来自于中国气象数据网(http://data.cma.cn/order/list/show_value/normal.html),主要包括年平均气温、年总降水量、平均日照数、平均风速,统计出逐年的气候数据来研究阿里地区气候总体变化趋势。所使用的数据来源于阿里地区气象局气象观测站。
3研究方法
3.1线性回归
为了研究阿里地区气候演变规律,本文采用一元线性方程对统计出的逐年的气候以及各个季节的气候值进行拟合,即:
剩余内容已隐藏,请支付后下载全文,论文总字数:16482字
相关图片展示: