Catalogue
Abstract 4
1.Introduction 5
2. Data and Methods 7
2.1 Study areas 7
2.2 Data sources and methods 8
3. Results and Discussion 10
3.1 Annual variation 10
3.2 Seasonal and monthly variation 12
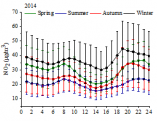
3.3 Diurnal variation 14
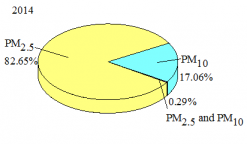
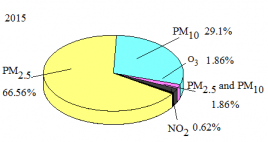
3.4 PM2.5/PM10 ratios and PM2.5/CO ratios 17
3.5 Impact of meteorological elements on pollutants 19
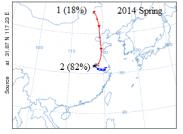
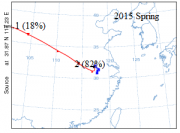
3.6 Pollutant source analysis 22
Conclusion 26
References 27
Thanks 31
Distribution Characteristics and Influencing Factors of Particulate Matter and Gaseous Pollutions from 2013 to 2015 in Hefei
Shao Yamei
Atmospheric Physics, NUIST, Nanjing 210044, China
摘要:
合肥市是安徽省的省会城市,该地区经济发展快速、产业规模大,城市化水平较高。近年来,合肥市人口密度不断增加、能源消耗不断增加,加上气候条件变化的影响,合肥市已经成为中国污染最严重的城市之一。本文主要研究了污染物SO2、NO2、CO、O3、PM2.5、PM10的变化特征及其与相对湿度、温度、压力、风速、风向和降水量等气象要素之间的关系。本文通过分析污染物监测数据来了解2013年12月至2015年11月期间合肥市大气污染物年变化、季节变化、月变化及日变化的主要特征。由于近两年采取了一系列环保措施,AQI的年平均值有所下降,2014年的年平均值为118.1±68.6, 2015年下降至86.6±38.1。SO2、CO、PM2.5和PM10的年变化与AQI相同, 2014年的年平均值分别为20.2 ± 10.6 µg/m3, 1.0 ± 0.4 mg/m3, 89.1 ± 59.4 µg/m3, 118.9 ± 66.8 µg/m3,2015年分别为 17.3 ± 8.8 µg/m3, 1.0 ± 0.3 mg/m3, 61.4 ± 32.2 µg/m3, 91.3 ± 40.9 µg/m3。但是NO2和O3浓度的年平均值却有所升高,2014和2015年分别为31±10.6 g/m3、64.8±29.4 g/m3。除O3 外的其他污染物浓度的季节变化都表现为冬季数值最高,夏季数值最低,而O3的季节变化表现为冬季浓度最低,夏季浓度最高。NO2、CO、PM2.5和PM10浓度的日变化中,在早晚高峰时期存在两个高峰,一个出现在上午8-10时,另一个出现在下午20~21时。污染物浓度在下午达到一天中的最低值,而夜间和清晨逆温和较差的大气条件使得污染物存在较高浓度。SO2的日变化曲线呈倒U形,春、夏、秋三季均在上午11时左右达到最大值,冬季最高值比其他三个季节晚约1小时。与光化学反应有关的O3 浓度随太阳辐射的变化而变化,在大约下午15时达到最大值。污染物浓度与风速、相对湿度和降水量呈负相关关系。O3和PM2.5浓度与温度呈正相关,这与其它污染物有明显的差异。根据PSCF、CWT模式的分析可知,合肥的空气污染不仅与本地排放有关,还受到周边城市的影响。通过后向轨迹分析可以得到污染物主要来源于本地排放以及京津冀地区和长三角地区的长距离运输。
Abstract
Hefei, the capital city of Anhui Province, is a region with rapid economic development, large industrial scale and a high level of urbanization in China. With the combined effects of increasing population density, increasing energy consumption and changing climate conditions in recent years, Hefei has become one of the most polluted cities in China. This paper mainly studies the change characteristics of pollutants and the relationship between pollutants, including SO2, NO2, CO, O3, PM2.5, PM10 and meteorological elements, including relative humidity, temperature, pressure, wind speed, wind direction and precipitation. The monitoring data of pollutants are analyzed to understand the main characteristics of the annual, seasonal, monthly, and diurnal variations of air pollutants in Hefei from December 2013 to November 2015. The annual average value of AQI in 2014 is 118.1 ± 68.6, and it decreases to 86.6 ± 38.1 in 2015. Annual variations of SO2, CO, PM2.5 and PM10 are same as that of AQI and their annual values in 2014 are which are 20.2 ± 10.6 µg/m3, 1.0 ± 0.4 mg/m3, 89.1 ± 59.4 µg/m3, 118.9 ± 66.8 µg/m3 separately are lower than that in 2015 which are 17.3 ± 8.8 µg/m3, 1.0 ± 0.3 mg/m3, 61.4 ± 32.2 µg/m3, 91.3 ± 40.9 µg/m3 separately attribute to a series of environmental protection measures. But the annual concentrations of NO2 and O3 increase significantly whose values are 28.2 ± 11.1 µg/m3, 50.4 ± 18.8 µg/m3 respectively in 2014 and 31.0 ± 10.6 µg/m3, 64.8 ± 29.4 µg/m3 respectively in 2015. Generally, the concentrations of pollutants except O3 have the maximum value in winter and the minimum in summer. The seasonal variation of O3 is different from other pollutants, with the characteristics of lowest concentration in winter and highest concentration in summer. There are two peaks corresponding to the rush hours of the morning and evening respectively in the diurnal variations of NO2, CO, PM2.5 and PM10 concentrations, one is about 8-10 am and the other is around 20-21 pm. The concentrations of pollutants reach the lowest values of a day in the afternoon. There are high concentrations at night and early morning, this may be caused by the temperature inversion and stable atmospheric condition. The diurnal variation curve of SO2 is inverted U-shaped. It reaches the maximum at about 11 am in spring, summer and autumn, the maximum value in winter would occur one hour later than the other three seasons. The concentrations of O3 related to the photochemical reaction change with the solar radiation and reach the maximum at about 15 pm. There is a negative correlation between the concentrations of contaminants and wind speed, relative humidity and precipitation. The positive correlation between concentrations of O3 and PM2.5 and temperature appears to be different from other pollutants. According to the analysis of Potential Source Contribution Factor (PSCF) mode and Concentration Weight Trajectory (CWT) mode, air pollution in Hefei is not only related to local emissions, but also affected by surrounding cities. It is known from the backward trajectory analysis, pollutants mainly come from local emissions and long-distance transportation in Beijing Tianjin Hebei region and Yangtze River Delta region.
Key word: pollutants, temporal variation, meteorological elements, pollutants source, PSCF, CWT
剩余内容已隐藏,请支付后下载全文,论文总字数:61759字
相关图片展示: