论文总字数:23461字
目 录
摘要 Ⅰ
Abstract Ⅱ
1 引言 1
1.1 研究目的及意义 1
1.2 国内外研究现状 1
1.3 本文研究内容 3
2 资料和方法 3
2.1 δ13C定义和计算方法 3
2.2 资料来源 4
2.3 方法 5
2.3.1 变化特征处理方法 5
2.3.2 与气象影响因素的关系处理方法 5
3 CO2摩尔分数和δ13C的变化特征 6
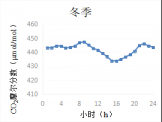
3.1 CO2摩尔分数和δ13C的日变化特征 6
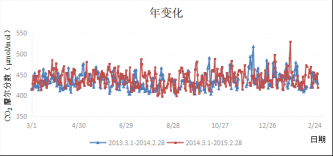
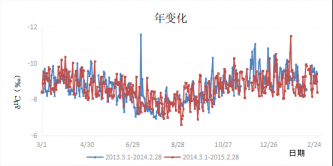
3.2 CO2摩尔分数和δ13C的年变化特征 8
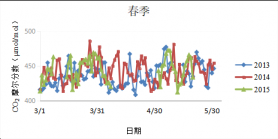
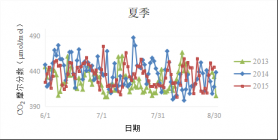
3.3 CO2摩尔分数和δ13C的季节变化特征 9
4 CO2摩尔分数和δ13C与气象影响因素的关系 12
5讨论 15
5.1 春季CO2摩尔分数排放规律原因讨论 15
5.2 春季δ13C变化规律原因讨论 15
6结论 17
参考文献 17
长江漫滩温室气体排放规律及其影响机制研究
余珂
,China
Abstract:Selecting the representative Nanjing section in the flood plain of the Yangtze River, based on the monitoring data of the concentrations of CO2 in the atmosphere and the ratio of 13C to 12C (expressed as δ13C) from 2013 to 2015 and the data of meteorological factors in this period, the variation characteristics of the concentrations of CO2 and δ13C and the relationship of its meteorological factors in the area are analyzed and studied. The variation characteristics mainly analyzed the daily variation, seasonal variation and annual variation rule, the correlation analysis is mainly used to analyse its meteorological factors. The results show that the daily variation of CO2 concentrations decreases during the day and rises at night and early morning. In autumn, the maximum daily variation of CO2 concentrations is observed, and the daily variation was lowest in winter. In spring, the peak appears at 08:00, and the minimum appears at 18:00.Contrary to the CO2 concentrations, δ13C shows the lowest value in the early morning in all four seasons and shows the highest value in the afternoon. The concentrations of CO2 per month in summer is slightly lower than that of other seasons, and the 13C / 12C ratio shows a more obvious seasonal cycle of the concentrations of CO2, while the CO2 concentrations shows a very weak seasonal characteristic. There is no significant correlation between CO2 concentrations and daily average temperature, daily average wind speed and daily average relative humidity in Nanjing site. However, there is a positive correlation between δ13C and the temperature and relative humidity, and there is a negative correlation between δ13C and the wind speed. The time variation of δ13C follows the seasonal pattern of human and biological CO2 emission, which is lower in winter than in summer.
Key words:Flood plain of Yangtze River, CO2, δ13C, Variation characteristics, Meteorological factors
1 引言
1.1 研究目的及意义
全球变暖已经成为全球变化中最显著特征之一,是当今世界最重大的全球性环境问题之一,并且这一趋势已然成为事实[1]。世界气象组织(World Meteorological Organization,WMO)和联合国环境规划署(United Nations Environment Programme,UNEP)于1988年成立了政府间气候变化专门委员会(Intergovernmental Panel on Climate Change,IPCC),来提供定期评估气候变化的科学基础、影响和未来风险,以及适应和缓解这种形式的措施。IPCC第四次报告显示,从1850年工业革命到2007年以来,全球气温发生显著变化,过去150年内全球气温大幅上升,增长速率也在不断加快。全球气温升高不是一个短短几年就能造成的问题,而是一个百年、千年尺度的问题,但是现阶段来看,温室气体浓度的增长速率在任何时段上看都是令人吃惊的。而二氧化碳(CO2)、甲烷(CH4)和氧化亚氮(N2O)就是大气中占比较高的温室气体,在全球变暖过程中占有超过70%的贡献。2016年春季,美国国家海洋和大气局(National Oceanic and Atmospheric Administration,NOAA)更新的NOAA第十次温室气体指数(Annual Greenhouse Gas Index,AGGI)报告表明除氟氯化碳-11和氟氯化碳-12外,所有温室气体的浓度均呈不断上升趋势,2015年温室气体指数比1990年升高了37%,其中,CO2对这一增长的贡献近80%。
漫滩一般位于河床和河谷谷坡之间,介于陆地和河流系统之间,具有其独特的、不同于单独系统间的气象、土壤、植被和水文特征。漫滩生态系统中有机物的残体在分解过程中,产生大量有机气体和无机气体,其中包括主要的三种温室气体N2O、CH4和CO2。在河口漫滩区,由于河流碳输入、沉积再悬浮以及沉积物中微生物过程、潮汐交换等,CH4和CO2的排放有较大的时空变异性。
据地质勘测报告显示,南京有近四分之三的区域位于长江及秦淮河古河道漫滩区,地层软弱,工程地质条件复杂[2]。是我国东部河口漫滩分布具有代表性的地区之一,具有很大的研究价值。因此,通过对南京温室气体浓度与气象等因素进行相关性分析,可以定性、定量的评价影响长江漫滩地区温室气体通量的因素。
1.2 国内外研究现状
目前世界各国均致力于温室气体排放清单,国际上许多发达国家已经提交了国家温室气体的排放清单,中国的温室气体排放估算工作从1980年末开始,在过去的二十多年里,我国学者已经研究观测了许多不同地点、不同类型湿地的温室气体排放通量。表1列出了中国学者对不同地点和类型湿地的温室气体排放通量的研究结果。
表1 不同地区N2O、CH4和CO2排放通量
研究区域 | 类型 | 排放通量 | 参考文献 | ||
N2O1) | CH42) | CO22) | |||
苏北 | 互花米草滩 | 15.7±7.9 | 766.3±496.9 | [3] | |
苏北 | 芦苇滩 | 17.4±5.0 | 0.420±0.900 | 558.9±379.8 | [3] |
苏北 | 碱蓬滩 | 6.7±0.5 | 258.0±142.5 | [3] | |
苏北 | 光滩 | 6.1±2.1 | -0.004±0.032 | 57.1±16.2 | [3] |
上海崇明东滩 | 低潮滩,夏季 | -27.6 | 0.04 | -86.3 | [4] |
上海崇明东滩 | 中潮滩,夏季 | 69.9 | 6.56 | 301 | [4] |
若尔盖高原 | 泥炭湿地 | 20 | 2.43 | 203.2 | [5] |
1)单位为µg·m-2·h-1 2)单位为mg·m-2·h-1
研究区域 | 类型 | δ13C (13C/12C) | 参考文献 |
滇池流域 | 三岔河入库河口(近处) | -23.66‰~-21.78‰ | [6] |
滇池流域 | 三岔河入库河口(远处) | -28.36‰~-26.36‰ | [6] |
贵州茂兰 | 喀斯特林地 | -27.0±0.1 ‰(表层土壤) | [7] |
-24.6±0.5 ‰(50cm深处) | |||
贵州茂兰 | 玉米地 | -20.2±0.4 ‰(表层土壤) | [7] |
-23.2±1‰(70cm深处) | |||
宁夏云雾山 | 灌木地 | -28.15‰(表层土壤) | [8] |
-26.11‰(40cm深处) | |||
宁夏云雾山 | 草地 | -27.08‰(表层土壤) | [8] |
-27.57‰(40cm深处) |
表2 不同地区δ13C (13C/12C)值
剩余内容已隐藏,请支付后下载全文,论文总字数:23461字
相关图片展示: