论文总字数:43645字
目 录
摘要 I
Abstract II
1 引言 1
1.1研究背景 1
1.2国内外研究进展 1
2 数据来源和数据处理 2
2.1数据来源 2
2.2数据处理 3
3 股票收益率数据概况 4
3.1股票收益率时序的概率分布特征 4
3.2股票对数收益率的描述性统计分析 7
4 ARIMA-EGARCH模型动态预测建模 8
4.1 ARMA模型和推广后的ARIMA模型 8
4.2 GARCH模型和推广后的EGARCH模型 9
4.3 基于ARIMA-EGARCH模型的股票收益率动态预测 11
4.3.1 对数收益率SGED分布 11
4.3.2 定参数预测模型实证分析 13
4.3.3 滚动窗口预测模型实证分析 17
4.4 ARIMA-EGARCH模型的评估分析 18
4.4.1 定参数模型评估 18
4.4.2 滚动窗口模型评估 22
5 总结 23
参考文献 24
附录 27
致谢 43
基于ARIMA-EGARCH模型的股票收益率预测研究
黄蓉蓉
, China
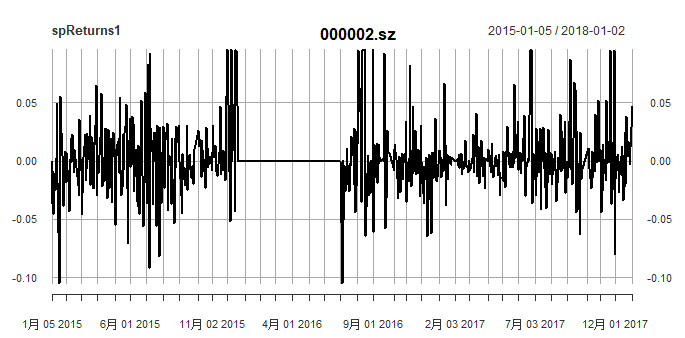
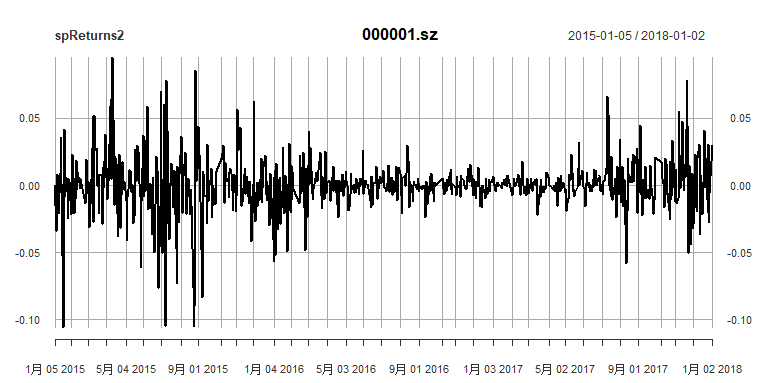
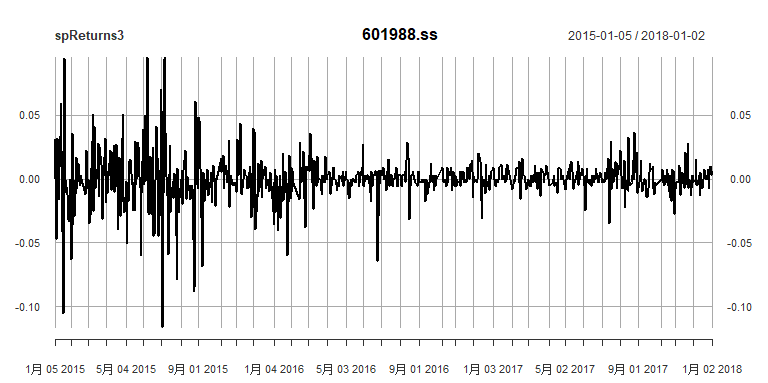
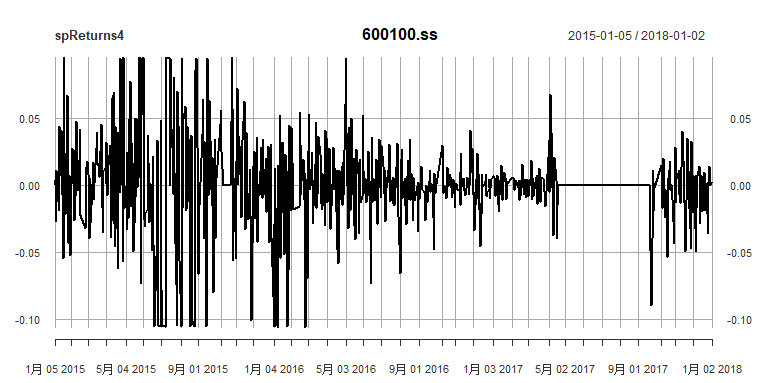
Abstract: Nowadays, the securities market plays an increasingly important role in China's economy, especially in the stock market. Researching the characteristics and trends of stocks and providing reasonable investment strategies are of great significance to the national economy. This paper selects the data of the six leading stocks from 2015.1.5 to 2018.1.2 as the research object, and establishes the stock yield prediction model. According to the characteristics of spikes, tails, biases, leverage effects, and fluctuating aggregation of stock returns, this paper constructs the ARIMA-EGARCH forecast model under the Skew-GED distribution. This paper uses the daily logarithmic returns data fitting model of 2015.1.5-2017.10.23 to get the optimal parameters, 2017.10.24-2018.1.2 as an independent sample inspection period, this time period logarithmic yield data into the optimal parameter model, the simulation of the daily stock yield forecast, and the comparison of the real value and the predicted value, The Fitting Effect of Multiple Descriptive Statistics Evaluation Models such as Goodness of Fit and Residual Autocorrelation. The AIC values of the five stocks are all less than -4, and the fitting effect is good, but Vanke A shares are not suitable for this model. Aiming at the improvement model of China Vanke A shares, the introduction of a dynamic time window, establishment of a time window of 500 (approximately two years of stock data), and continuous updating of forecasting model parameters, to predict the next-period stock return value, and draw the comparison chart of the two-year cumulative rate of return versus the cumulative value of real rate of return and the original model. According to the performance check and the comparison chart of the inspection period, the model has a good effect, and the AIC value = -7.27 lt;-5.83. For the stock with no abnormal fluctuation, the ARIMA-EGARCH model under SGED distribution has better prediction effect. For stocks with longer time period, the rolling window dynamic model has better prediction effect.
Key words: Higher peak and fat tail; Skew-GED distribution; Constant parameter and variable parameter ARIMA-EGARCH dynamic prediction model
1 引言
1.1研究背景
我国股票市场起步较晚,至今为止才27年的发展历程,由于特有的国情和制度因素,相比于国外成熟的股票市场有效程度较低,股票指数的波动相对较大,“暴涨暴跌”的现象时有发生[1]。所以预测商业利率在最近几年越来越受到关注,特别是因为利率是影响消费者、企业、金融机构、专业投资者和决策者决策的关键财务变量。利率的变动对经济周期有重要的影响,并且对于理解金融发展和经济政策的变化是至关重要的。因此,及时的利率预测可以为金融市场参与者和决策者提供有价值的信息。利率预测也有助于降低个人和企业面临的利率风险[2]。同理,股票收益率预测在金融市场特别是证券市场有着极大的积极作用。
1.2国内外研究进展
1.2.1国内研究现状
我国目前两大证券交易所分别为上海交易所和深圳交易所,综合指标分别为上证指数[3]和深证指数[4]。如附图1、附图2。截至2018年4月4日,上证指数的价格为3,131.11。截至2018年4月4日,深证综合指数的价格为10684.56。
我国上海证券交易所建于1990年12月,深圳证券交易所建于1991年7月,成立时间较晚于西方,至今才27载。2017年股票累积交易244天,每日平均成交的金额数高达4609.12亿元,日均成交数量为359.76亿股,交易印花税达到1126.64亿元[5]。
在研究股票收益率波动性方面,我国也取得了较好的成果。1999年,丁华建立了ARCH(1)和ARCH(2)模型,并用高模型分析了上证指数中的ARCH效应[6]。2001年,岳朝龙,陈千里,周少甫对上海股市、上证指数的实证分析证明了我国股票收益率存在GARCH效应[7-8]。2006年,孔华强证明了我国上证180与深证100均存在ARCH效应,并采用了EGARCH(1,1)模型模拟了A股和H股的波动性[9]。随着我国股市的日益发展并规范化,研究股市波动性吸引了越来越多学者的目光,对此的研究也会进一步深化[10]。
1.2.2国外研究现状
世界上最早的证券交易所建立于荷兰,阿姆斯特丹证券交易所,随后英国、法国也相继建立证券交易所,美国第一所证券交易所纽约交易所建立于1811年。显而易见,西方证券市场已有长达 100 多年的发展历程,经济体制发展较好,证券市场较为成熟稳定,股票指数波动幅度相对较小[11]。
由附图3可以看出2008年西方证券市场遭遇了一次巨大经济危机后,逐步上升,目前指数在24000-26000之间。在2015-2018年这一段曲线中,这也是我国证券市场动荡较大的两年,西方证券市场也从低谷逐步上升,Dow Jones工业平均股票市场指数[12]以较快的趋势上升至24000点以上,曾在2015中旬、2016年初跌至16000点以下,如附图3。
西方有较为成熟的证券市场,在波动性方面的研究也比我国早很多,研究成果也是巨大的。早在1965年,Fama最先发现了股票具有尖峰厚尾的特征;1976年Morgan发现股票收益率的方差是实时变动的,也就是后来所说的时间序列的异方差性[10]。后来的研究者们都以此为基础建立时间序列的波动性的模型。1982年,Engle提出ARCH模型,模拟股票波动性[13];1986年,Bollerslev[14]推广了ARCH模型,提出了广义自回归条件异方差模型(GARCH模型),将均方误差和条件方差加入了波动模型中。在此后的研究中,人们又发现了“杠杆效应”,即金融时间序列在波动中存在非对称的特点,利空消息对股市波动的影响程度大于利好消息。所以此后的研究上都会对“杠杆效应”进行分析,改进为更合适的波动性模型[10]。1991年,Nelson提出了EGARCH模型,也就是本文中核心模型之一,并且他的文章中指出“杠杆效应”的影响是呈指数形式的,该模型简化了计算过程,在波动性动态预测方面模型拟合度更高,并且使得条件方差的预测值保持非负[15]。
总体而言,西方在研究成果方面比我们深厚,但介于我国证券市场的特殊性,我国的研究者们更需要研究适合我国证券市场的模型,随着我国证券市场的日益壮大,相信在不久的未来,会有越来越成熟的研究模型专门研究我国股票的波动性。
剩余内容已隐藏,请支付后下载全文,论文总字数:43645字
相关图片展示:
该课题毕业论文、开题报告、外文翻译、程序设计、图纸设计等资料可联系客服协助查找;