论文总字数:21976字
目 录
摘 要 1
Abstract 2
1. 研究目的及意义 4
2. 国内外研究现状 5
2.1 叶面积指数反演关键技术研究现状 5
2.2 基于ArcGIS的叶面积指数可视化表达的研究现状 6
3. 研究内容 7
3.1 数据来源与设计原理 7
3.1.1 研究区和数据来源 7
3.1.2 设计原理 8
3.2 技术路线 10
4. 叶面积指数演示系统开发平台简介 11
4.1 .NET平台概述 12
4.1.1 .NET平台介绍 12
4.1.2 .NET FrameWork4.0新特性 12
4.2 系统开发环境 13
4.2.1 组件对象模型COM 13
4.2.2 ArcGIS Engine的介绍 13
5. 叶面积指数演示系统总体设计 13
5.1 引言 13
5.2 系统结构设计 14
5.2.1 系统设计原则 14
5.2.2 系统结构划分 15
5.3 系统功能设计 16
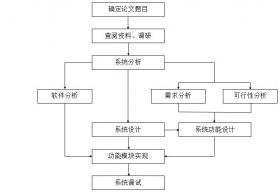
5.4 系统开发流程 18
6. 系统功能实现与测试 18
6.1 数据导入与文件管理功能的实现 18
6.2 生态监测功能实现 22
6.3 专题地图制作和地图输出功能实现 24
6.4 系统测试 26
6.4.1 环境测试 26
6.4.2 功能测试 26
7. 总结与展望 26
7.1 本文总结 26
7.2 研究展望 27
8. 参考文献 27
致 谢 29
基于ArcGIS的叶面积指数演示系统开发研究
摘 要
植被的分布与人们的生活密切相关,同时,LAI也是植被结构特征的重要参数之一。植物的光合作用、呼吸作用、蒸腾作用以及能量交换等多种生理过程也受植被叶面积指数影响着,另外,对于区域特性,叶面积指数的动态变化也会产生重要的影响,随着计算机技术的快速发展,地信、遥感技术也随之日新月异,发展迅速,目前,有两种获取叶面积指数的方法:地面测量的方法和遥感测量的方法。地面测量法虽然精度高,但是耗时长、破坏性强等局限性,因此利用定量遥感反演LAI并将LAI可视化表达出来,对于叶面积指数的研究具有重要意义。针对上述的问题,在Visual Studio 2010 C#.NET的开发环境下,本文设计了基于ArcGIS的叶面积指数演示系统。
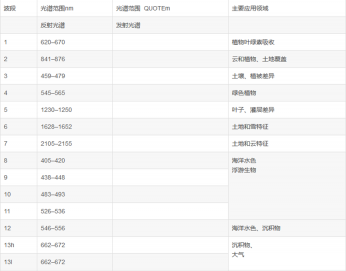
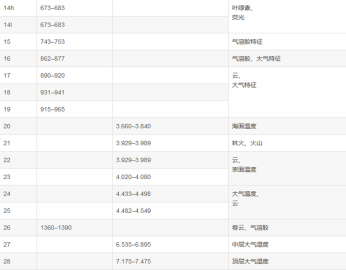
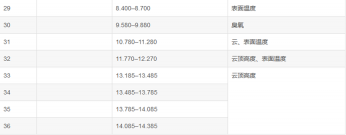
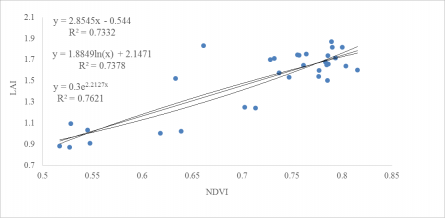
首先,通过使用ENVI5 IDL8的模块,对获取的波段信息进行解析和预处理;接着,确定LAI反演模型,利用参考总结的基于植被指数经验关系反演模型与选取研究区域的32个采样点的LAI数据进行综合分析,建立了NDVI-LAI三种回归模型,即线性模型、对数模型和指数模型,结果表明,NDVI与LAI有比较好的正向相关性,针对所选的研究区域来看,其中指数模型的拟合程度为0.7621,由于线性模型和对数模型,因此在后面的叶面积指数反演中优先选择指数模型对LAI进行反演。
然后,基于ArcGIS独特的二次开发方式——ArcGIS Engine、OOP(Object Oriented Programming)和COM(Component Object Model)组件,实现了数据导入、波段运算(以归一化植被指数NDVI为主)、叶面积指数LAI的反演、栅格图像渲染、地图整饰以及成图等多种功能,最终较为准确的对吉林省通化市的叶面积指数反演出来,清晰地反映出植被的分布情况。
最后,对系统进行环境与功能的测试,以确保系统的运行安全及数据计算的准确性。
关键词:Visual Studio,可视化,NDVI,叶面积指数,经验模型
Abstract
The distribution of vegetation is closely related to people's lives. At the same time, LAI is a key parameter of vegetation canopy structure. Various physiological processes such as photosynthesis, respiration, transpiration, and energy exchange of plants are also affected by the leaf area index of vegetation. Influencing, in addition, for regional characteristics, the dynamic change of leaf area index will also have an important impact. With the rapid development of computer technology, the local letter and remote sensing technology are changing with each passing day. At present, there are two methods to obtain the leaf area index: Ground Measurement methods and remote sensing methods. Although the ground measurement method has high precision, but it is time-consuming and destructive. It is important to use the quantitative remote sensing to invert the LAI and visualize the LAI. This is of great significance for the study of leaf area index. In view of the above problems, this paper designs the demonstration system of leaf area index based on ArcGIS under the environment of Visual Studio2010 C#.NET.
First, by using the module of ENVI5 IDL8, the obtained band information is analyzed and pre-processed; then, the LAI inversion model is determined, and the inversion model based on empirical correlation of vegetation index and the 32 sampling points of the selected study area are summarized by reference. The LAI data were comprehensively analyzed, and three NDVI-LAI regression models were established, namely the linear model, the logarithmic model and the exponential model. The results show that NDVI and LAI have a better positive correlation and are targeted against the selected study area. The fit of the exponential model is 0.7621. Because of the linear model and the logarithmic model, the index model is preferentially chosen to invert the LAI in the latter leaf area index inversion.
Then, based on the ArcGIS Engine, OOP (Object Oriented Programming) and COM (Component Object Model) components of ArcGIS's unique secondary development method, data import, band operation (based on the normalized vegetation index NDVI), and leaves were realized. The functions of LAI inversion, raster image rendering, map finishing, and mapping have finally accurately reversed the leaf area index of Tonghua City, Jilin Province, and clearly reflected the distribution of vegetation.
Finally, the system is tested for its environment and functionality to ensure the system's operational safety and data calculation accuracy.
Key words: Visual Studio, Visualization NDVI, Leaf Area Index, Empirical Model
研究目的及意义
植被的分布状况人们的生活极为密切,另外,农业生产和作物种植等许多产业与植被叶面积指数LAI的改变也有很大的关系。叶面积指数(Leaf Area Index,LAI) ,我们通常被定义为单位面积上叶片面积比上地面的面积[1]。另外,在地球的生态系统中,叶面积指数LAI也具有非常重要的意义,它的变化趋势代表了在一定的区域内,叶面积指数增大,那么作物的产量也随之增高,但叶面积指数的增加,受到一定的限制,达到这个限度后,植被间会相互遮挡,植被无法接收到足够的阳光,那么它的将光能装化为体内能量的能力就会减弱,植被的总量就会减少,这就是人们越来越关注最佳叶面积指数的原因。然而,针对于地面测量叶面积指数的方法,虽然地面测量法的精度比较高,操作容易,但是因为它耗时耗力并且对植被的损害比较大,同时,在时间有限的情况下很难完成大量的测量工作,而且,时间连续性差以及其它的局限性的影响,应用范围受到很大的限制,对于决策者和公众来说缺乏直观性也不易于理解,因此LAI分布情况的直观可视化表达十分必要。
植被的叶面积指数对植被的冠层结构存在很大的影响力,它会使地球上的很多生态过程比如光合、呼吸作用和新成代谢等发生变化[2],并且它对其它不同种类的生物也很重要,区域气候特征也会影响LAI动态变化,二者之间息息相关。随着计算机技术的发展,GIS、遥感作为强有力的工具和收段,越来越被人们应用于准确地估算LAI,并借助它们来进行应用。
近年来,随着计算机技术的快速发展,地理信息系统(Geographical Information System,简称GIS)愈发地受到人们的青睐,在许多信息系统的形成中,地理信息系统发挥了十分重要的作用,比如说,能够实现空间地理数据的分析以及处理,同时,能够应用在地理空间数据的采集、管理、存储、处理和显示等方面[3]。然而,专业的GIS软件价格很昂贵,如:ESRI公司的ArcGIS, 超图公司的SuperMap等,此外,学习起来也较为困难,不利于公众的使用。ESRI ArcGIS Engine于2004年通过ArcGIS Engine开发工具包推出,在ArcGIS Engine发布之前,基于ArcObjects的开发仅在大型ArcGIS Desktop基础架构中可用,并且部署在ArcGIS Desktop框架之外,提供了一组GIS组件。
ArcGIS Engine作为叶面积指数演示系统的开发平台,因为该系统的开发是基于COM,因此,我们针对于任何支持COM的编程语言都可以对其进行调用,除此之外,通过ArcGIS Engine编程开发的功能,可以实现对GIS功能进行方便快捷的配置,这样不仅可以记录下在执行命令时的独立的应用程序,而且还可以将GIS的很多的相关功能嵌入到目前现有的软件当中去。我们知道,ArcGIS Engine主要由两个部分组成,第一是在构建GIS软件时,所用的开发工具包,英文名称为:ArcGIS Engine Developer Kit;第二个是ArcGIS Engine Runtime,它的分布式的、为应用程序提供运行基础的运行时。
剩余内容已隐藏,请支付后下载全文,论文总字数:21976字
相关图片展示:
该课题毕业论文、开题报告、外文翻译、程序设计、图纸设计等资料可联系客服协助查找;